Styling with CSS
The CSS extension module allows to build map styles using a compact, expressive styling language already well known to most web developers: Cascading Style Sheets.
The standard CSS language has been extended to allow for map filtering and managing all the details of a map production. In this section we’ll experience creating a few simple styles with the CSS language.
Creating line styles
From the main menu bar select the CSS styles entry
Click on the “Choose a different layer” link and switch to the Mainrd layer
Click on the “Create a new style” link and input
css_mainrdas the style name, then press the “Create” button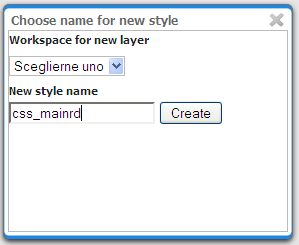
Creating a new CSS style for the Mainrd layer
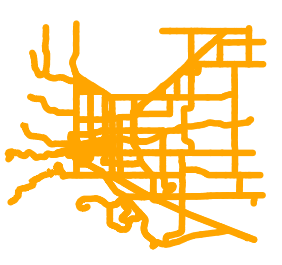
Set the style contents to the following, press submit and switch to the map preview
* {
  stroke: orange;
  stroke-width: 6;
  stroke-linecap: round;
}
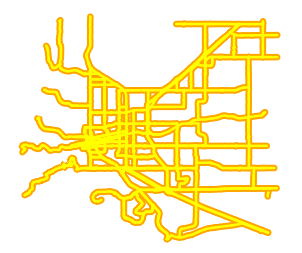
Now let’s create a cased line effect by adding a second set of colours and widths, and forcing two different z indexes for them. Press submit, look at the map and at the generated SLD
* {
  stroke: orange, yellow;
  stroke-width: 6, 2;
  stroke-linecap: round;
  z-index: 1, 2;
}
Finally, let’s add a label that follows the road
* {
  stroke: orange, yellow;
  stroke-width: 6, 2;
  stroke-linecap: round;
  z-index: 1, 2;
  label: [LABEL_NAME];
  font-fill: black;
  font-family: Arial;
  font-size: 12;
  font-weight: bold;
  halo-color: white;
  halo-radius: 2;
  -gt-label-follow-line: true;
  -gt-label-group: true;
  -gt-label-repeat: 400;
  -gt-label-max-displacement: 50;
}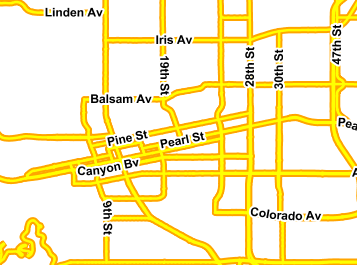
Creating point styles
Similarly to the previous section, switch the map to “bptlandmarks” and create a new style called “css_bptlandmarks”
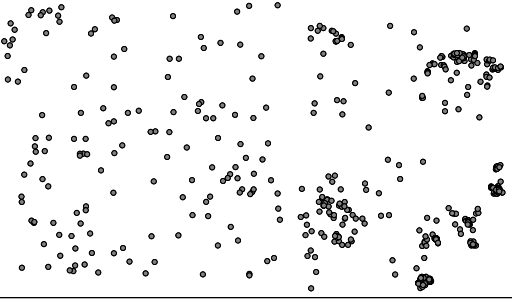
Insert the following in the CSS to get a basic point style, and press “Submit”:
* {
  mark: symbol('circle');
  mark-size: 5;
}
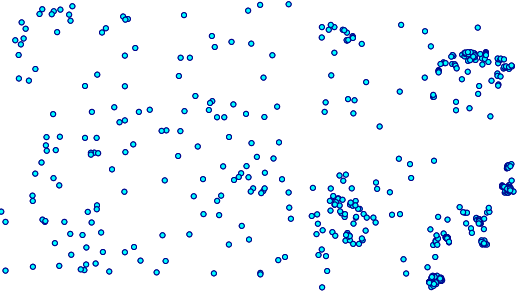
Let’s change the color of the points by specifying a fill. If we specified a fill in the top level rule it would be interpreted as a polygonal fill, to express that we want to fill inside the marks we have to create a new rule with the
:markpseudo-selector:* { mark: symbol('circle'); mark-size: 5; } :mark { fill: cyan; stroke: darkblue; }
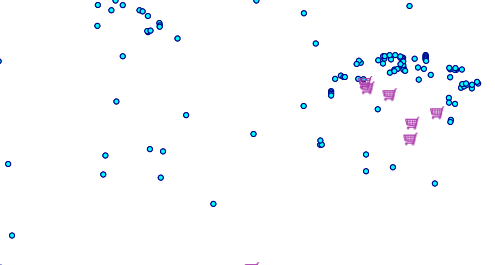
Finally, let’s override the default styling for all shopping centers. Shopping centers are not easy to find, they have a
MTFCCcategory ofC3081and containShoppingin the name* { mark: symbol('circle'); mark-size: 5; } :mark { fill: cyan; stroke: darkblue; } [MTFCC = 'C3081' AND FULLNAME LIKE '%Shopping%'] { mark: url("./img/landmarks/shop_supermarket.p.16.png"); mark-size: ; }
Creating polygon styles
For this exercise, change the current layer to “WorldCountries” and create a new style called “css_worldcountries”
We want to create a simple 3 class thematic map based on the country population, stored in the
POP_ESTattribute[POP_EST < 10000000] { fill: lightgrey; } [POP_EST >= 10000000 AND POP_EST < 50000000] { fill: olive; } [POP_EST > 50000000] { fill: salmon }
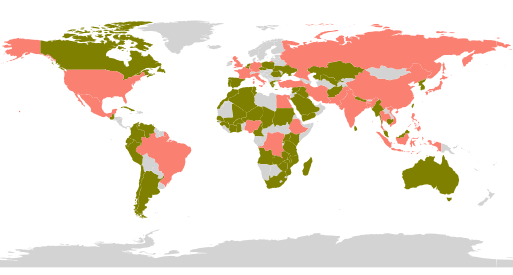
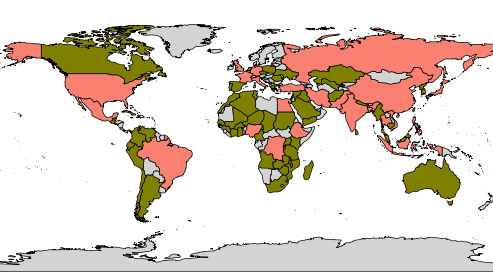
Let’s also add a very thin black border around all polygons, regardless of their population, using the
*selector[POP_EST < 10000000] { fill: lightgrey; } [POP_EST >= 10000000 AND POP_EST < 50000000] { fill: olive; } [POP_EST > 50000000] { fill: salmon } * { stroke: black; stroke-width: 0.2; }
Styling raster data
For this exercise we are going to switch to the “srtm” layer and create a new
css_rasterstyleIn order to activate raster styling the
raster-channelsproperty needs to be specified, in this case with a value ofautoto let the engine choose automatically the bands to use:* { raster-channels: auto; }
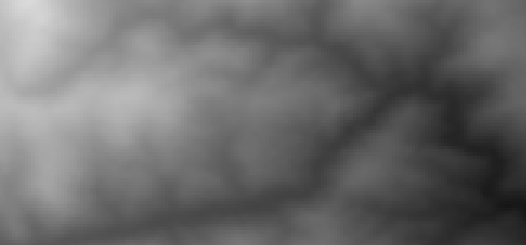
The above map shows GeoServer automatically creating a grayscale map out of the elevation data, with automatic adaptation to the current contents of the map (the black areas you see once applied the map are “no data” areas, try to go into an area that does not have any)
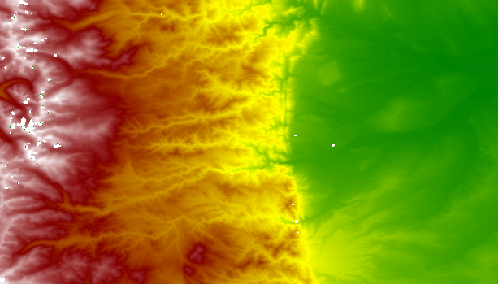
Now let’s apply a color map to get a nicer and consistent looking map instead
* {
   raster-channels: auto;
   raster-color-map:
     color-map-entry(black, 0, 0)
     color-map-entry(green, 1500)

     color-map-entry(yellow, 2000)
     color-map-entry(maroon, 3000)
     color-map-entry(white, 4000);
}