Creating Widgets
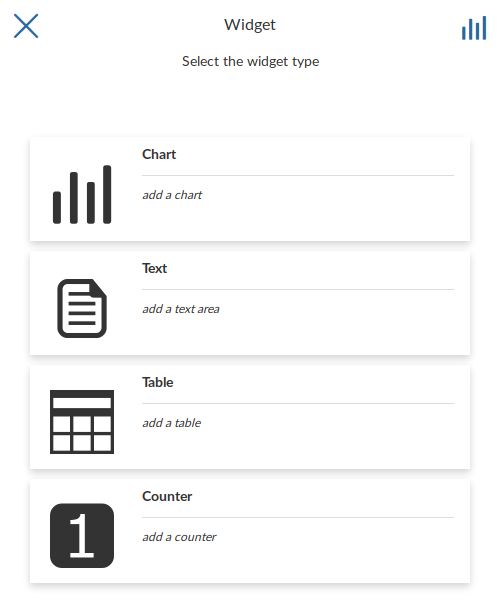
Widgets are graphical elements that describe the layers data. They can be of different types such as Charts, Texts, Tables and Counters.
Through the  button of the Table of Contents (TOC) you can open the Widgets panel.
Creating Widgets
Chart Widgets
Chart Widgets are graphical representations of the layer data. They can be Bar Chart, Pie Chart or Line Chart as shown in the picture below.
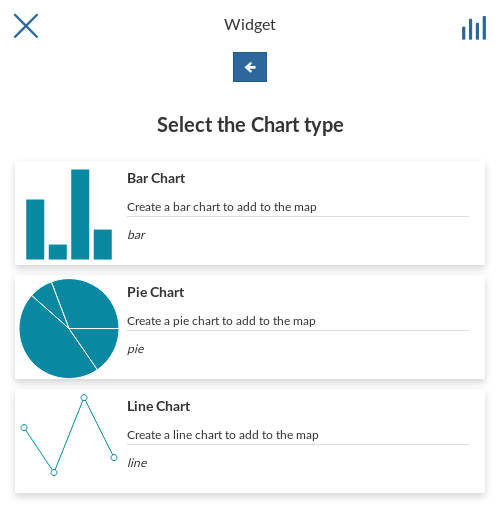
Chart Widgets
 . We don’t need any filter so click
  to configure other widget options.
Insert a Title and a Description and click on Save
to configure other widget options.
Insert a Title and a Description and click on Save  .
.
Chart Widgets Creation
The green  icon means that the chart is connected to the viewport.
Expanding the options menu of the widget you can Show the plotted data, Edit the widget or Delete it, Download the data as a CSV file or Export the image of the graph.
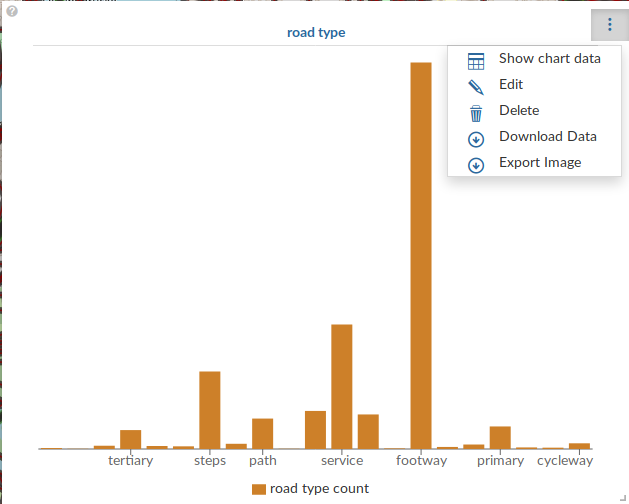
Chart Widgets Options
Text Widgets
If you select Text on the Widgets panel you can create Text Widgets. Add a Title and the desired descriptive text, then click on .
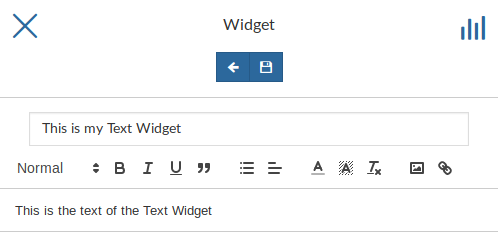
Text Widgets Creation
The resulting widget looks like the following.
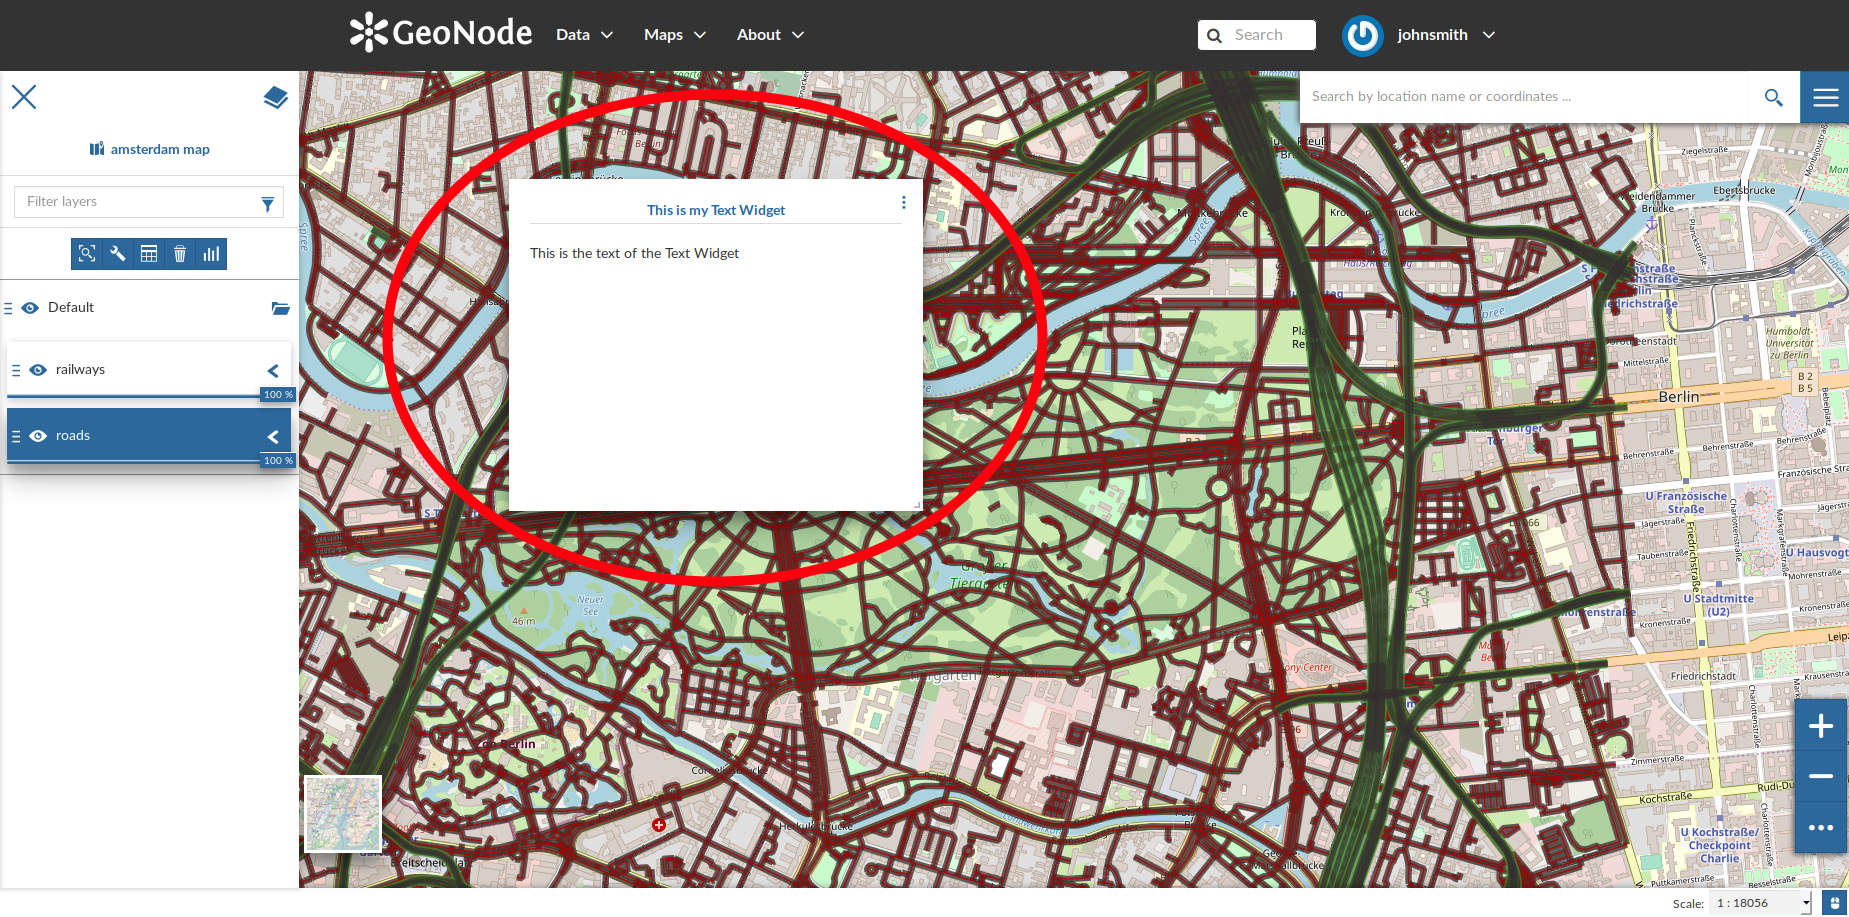
My Text Widget
Table Widgets
.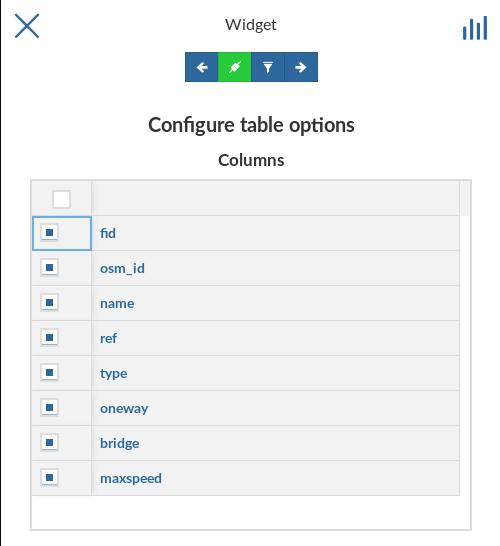
Table Widgets Columns
Insert Title and Description (optional) and click on . The example below shows the Table Widget on the map.
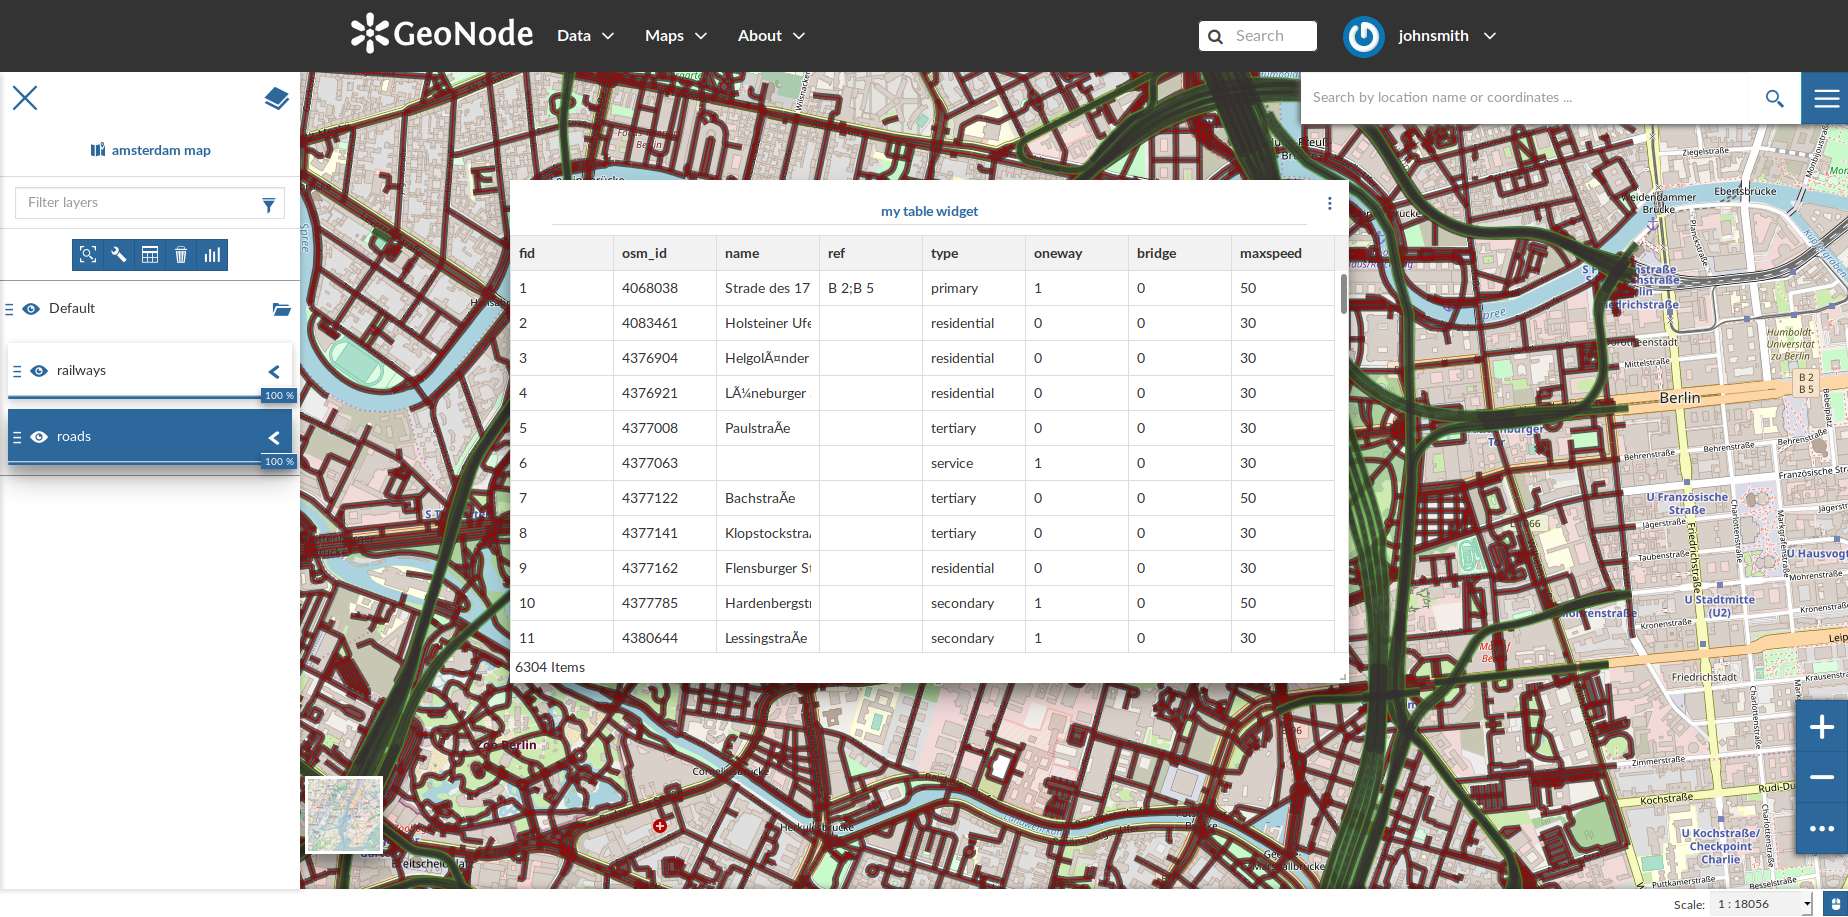
Table Widget
Counter Widgets
Counter Widgets are numeric representations of some attributes. For example you can represent the average speed limit on a road network.
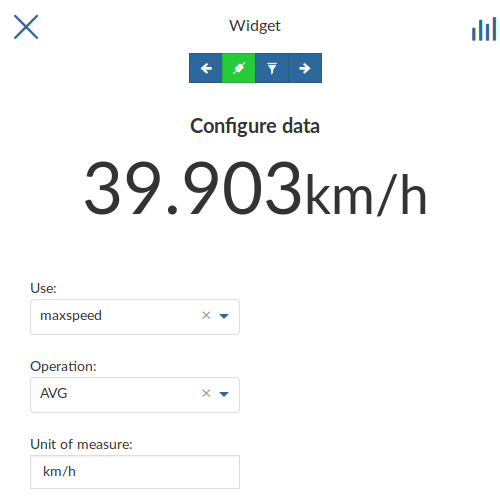
Counter Widget Creation
Click on , insert Title and Description then click on .
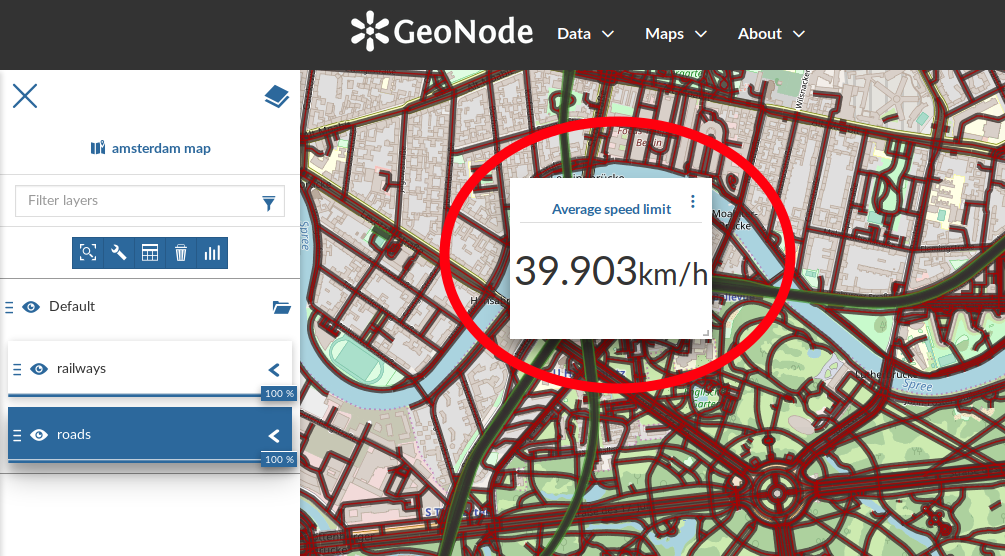
Counter Widget
The GeoNode map viewer is MapStore based, see the MapStore Documentation for further information.